Ask AI about your portfolio, and get answers from your real holdings
Most AI tools can only discuss the portfolio you paste into them. Ask Snowball Analytics reads your synced holdings, transactions and dividend history, then computes the answer: cost basis, forward income by month, look‑through fund exposure, benchmark gap. Plain question in, real numbers out.
14‑day free trial · No credit card · Read‑only access · Not used to train models
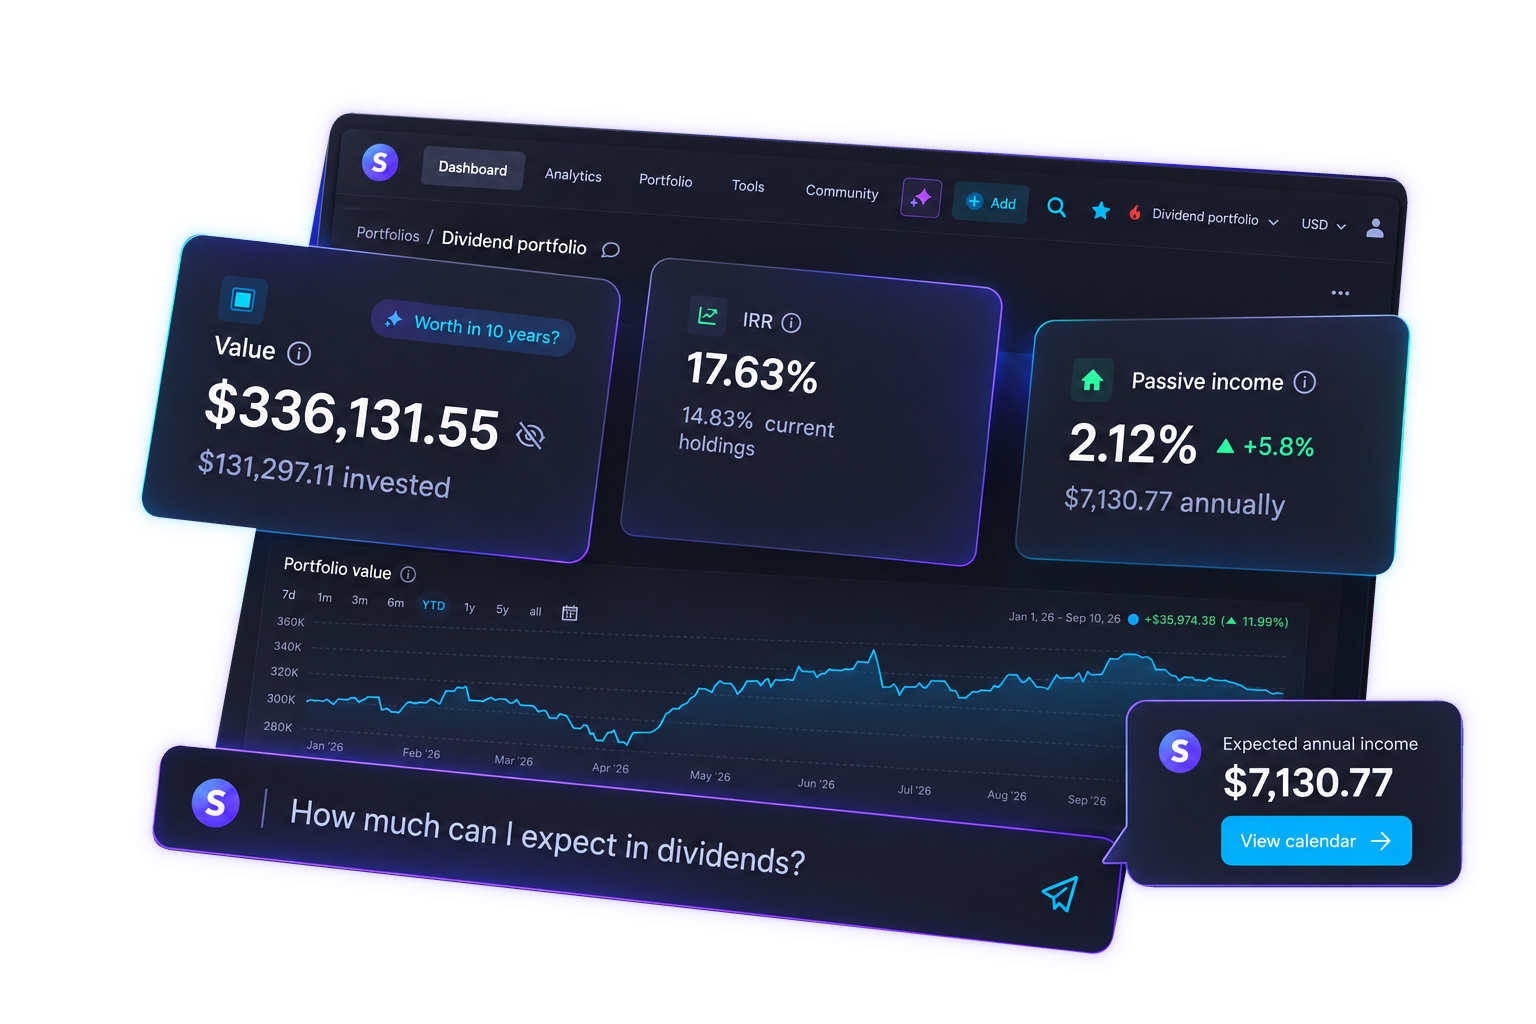
ChatGPT cannot see your portfolio by default
You can paste a holdings list into any chatbot and get a confident answer. The problem is what a pasted list leaves out: purchase dates, cost basis, dividends already received, cash, fund constituents, today’s prices. Without those, the arithmetic is guessed.
Pasting a list into a general chatbot
- No current prices, so values are estimated or out of date
- No transaction history, so no cost basis and no real return
- No dividend records, so income is inferred from a yield figure
- Cannot look through an ETF to its holdings
- Numbers are produced by a language model, which is where confident errors come from
- Your full position list sits in a general‑purpose service
Ask Snowball Analytics
- Prices across 70+ exchanges, synced from 1,000+ brokers
- Full transaction history, so real cost basis and real return
- Actual dividends received, plus a forward calendar month by month
- Fund X‑Ray resolves what you really own inside each ETF
- Figures are computed from your data, and the model explains them rather than inventing them
- Read‑only access; what is sent is anonymized, and Snowball Analytics does not use it to train models
Three steps, then just ask
The context stays current without a new routine. Once a broker is connected, every answer reflects today’s holdings rather than a snapshot you remembered to update.
Connect or import
Automatic sync with 1,000+ brokers keeps holdings, transactions and cash current. No connection for your broker? Import a statement or spreadsheet. Both can live in the same portfolio.
 Fidelity
 Charles Schwab
 Vanguard
 Interactive Brokers
 E*TRADE
 M1 Finance
Ask in plain language
Type the question the way you would say it, in the language you think in. Follow‑ups keep context, so “and what about from August?” works without restating anything.
Get a computed answer
Every figure traces back to your holdings and transactions. Where an assumption is needed, such as a return rate or a dividend growth rate, it is shown and you can change it.
Every number below comes from a portfolio you can open
The answers on this page are worked against three public Snowball Analytics portfolios. Open any of them and check the figures yourself, including the unflattering ones.
Demo portfolio
- Value
- $190,003.31
- IRR
- 11.9%
- Yield
- 2.1%
- Annual income
- $3,588.06
- Beta
- 0.788
Ryne’s Portfolio
- Value
- $143,865.77
- IRR
- 13.43%
- Yield
- 3.27%
- Annual income
- $4,704.41
- Largest
- SCHD
Utbyttereisen
- Value
- NOK 7.83m
- IRR
- 42.21%
- Yield
- 7.81%
- Annual income
- NOK 548k
- Top position
- 21.7%
100 questions investors ask about a portfolio, with answers
Ten topics, ten questions each. Every entry gives a short answer to the question itself, then shows the same measure worked against a live portfolio you can open and verify.
Rate & review my portfolio
What a portfolio rating can measure, what it cannot, and why a single score hides more than it shows.
Covers searches for rate my portfolio, portfolio review tool, portfolio health check
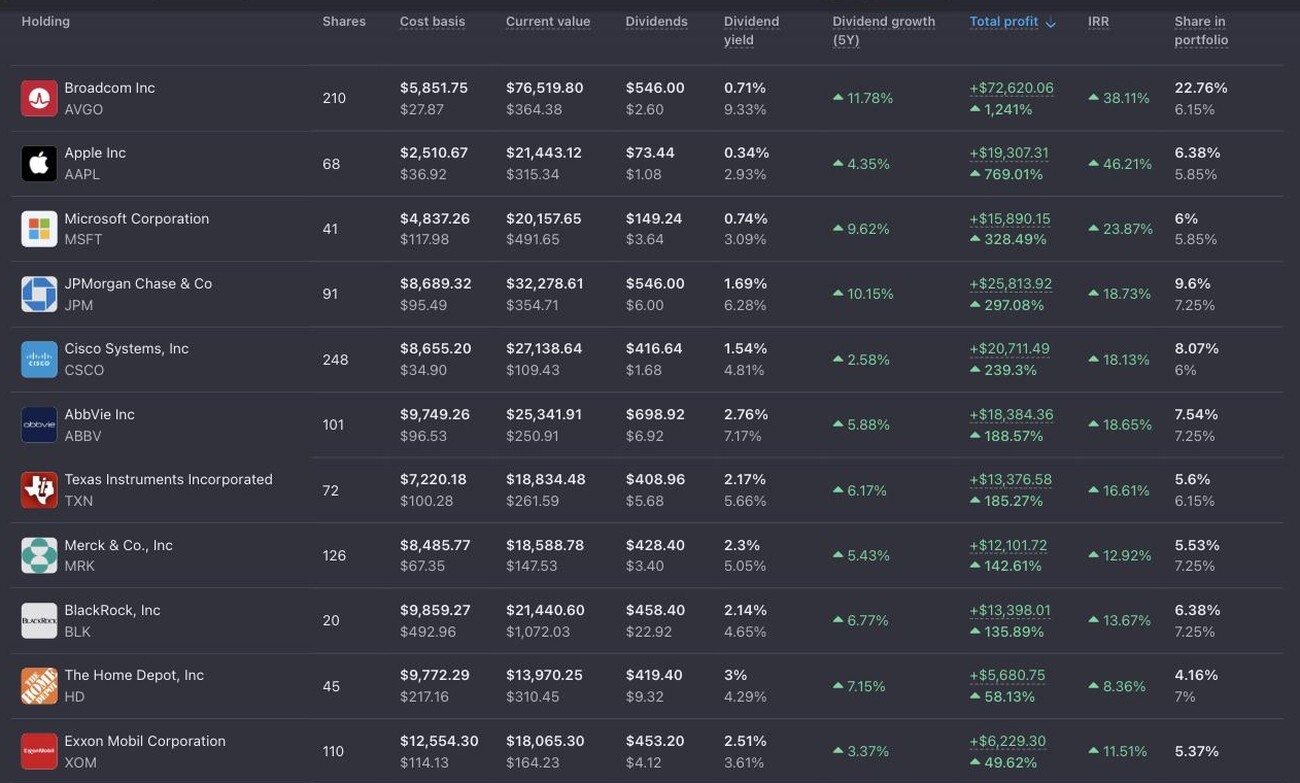
Rate my portfolio: what does that actually measure?
A portfolio rating is not a verdict on whether your holdings are “good”. It is a summary of measurable properties: concentration, sector and currency spread, income reliability, cost, volatility relative to a benchmark, and how far the portfolio has drifted from the target allocation you set.
Run on the Snowball Analytics Demo portfolio ($190,003.31 across 10 holdings, snapshot 18 Sep 2026), those properties read: top three positions 50.99% of value, weighted P/E 33.9x, beta 0.788, Sharpe 0.618, Sortino 0.925, and an actual fund weight of 33.24% against a 45% target. None of those numbers is a recommendation. They are descriptions.
Source: Demo portfolio › Metrics
Describe the strengths and weaknesses of my portfolio in terms of risk and return
Strength and weakness are only meaningful against a stated objective, so Ask asks for one: a capital target, an income target, or a date. It then reports which measured properties help that objective and which work against it, without telling you what to hold.
Example, Demo portfolio: return since inception is +99.3% (+$94,691.17) with an IRR of 11.9%, while measured volatility sits below the market at beta 0.788. Against that, risk-adjusted return is modest, at Sharpe 0.618 and Sortino 0.925, where a Sortino above 2 is the conventional “good” threshold.
Source: Demo portfolio › Metrics
How is my portfolio doing?
A deceptively simple question with four possible meanings: today, this year, since you started, or versus an alternative. Ask answers all four, because a portfolio can be up on the day and behind its benchmark over a decade at the same time.
Demo portfolio on 18 Sep 2026: +$651.05 (0.34%) on the day, +$8,467.25 (4.66%) over the trailing year, +$94,691.17 (99.3%) since inception, and 53.12 percentage points behind SPY on time-weighted return over the same lifetime. All four are true simultaneously.
Source: Demo portfolio › Common, Growth, Metrics
What is the weakest area of my portfolio?
“Weakest” is resolved by ranking measurable gaps rather than by opinion: largest single-name weight, largest share of income from one payer, biggest drift from target allocation, worst risk-adjusted return, and the holding with the poorest contribution to the stated goal.
In the Demo portfolio the largest measured gaps are income concentration, where JEPI produces 57.5% of all dividend income from 14.8% of the capital, and allocation drift, with stocks at 44.79% against a 30% target. Whether either matters is a decision for the investor, not the tool.
Source: Demo portfolio › Dividends, Common
Can AI give my portfolio a score out of 10?
Ask deliberately does not issue a single score. A one-number rating hides the trade-off that actually matters: a portfolio optimised for income scores badly on growth measures, and the reverse. It also reads like a recommendation, which this is not.
Compare two real public portfolios: the Demo portfolio yields 2.1% with an 11.9% IRR, while Utbyttereisen yields 7.81% with a 42.21% IRR and 38.15% in industrials alone. A single score would rank them; the measurements explain them.
Source: Public portfolios
Roast my portfolio
Phrased as a joke, answered as an audit. Ask returns the same measured observations it would give a polite question: concentration, drift, income dependence, cost drag, benchmark gap. The verdict language stays absent, because entertainment framing does not change what the numbers say.
On the Demo portfolio the audit surfaces: 50.99% in three positions, one ETF supplying 57.5% of income, 10.4% sitting in cash against a 15% target, and a lifetime time-weighted return of 99.35% against SPY's 152.47%.
Source: Demo portfolio › Metrics
How does my portfolio compare to other investors' portfolios?
Snowball Analytics hosts public portfolios you can open and read in full: holdings, weights, yields and returns. Ask can contrast your measured properties against a named public portfolio, which is a far more concrete comparison than an abstract benchmark.
Three live examples span the range: the Demo portfolio (10 holdings, 2.1% yield, 11.9% IRR), Ryne's Portfolio (21 holdings, 3.27% yield, $4,704.41 a year, 13.43% IRR) and Utbyttereisen (18 holdings, 7.81% yield, 42.21% IRR, 21.7% in one shipping name).
Source: Public portfolios
What questions should I ask about my own portfolio?
The questions that pay off are the ones a spreadsheet cannot answer in one step: where income actually comes from, what happens to the plan if a contribution changes, how much of a return came from one position, and how far reality has drifted from the target.
A practical starting set covers ten areas: future value and projections, dividend income, risk and diversification, performance against a benchmark, allocation and drift, what a hypothetical trade would change, taxes and fees, currency exposure, cost basis, and plain holdings lookups. The ten sections below follow that order.
Source: Method
Is my portfolio good for a beginner?
Ask will not label a portfolio suitable or unsuitable for anyone, because that is a personal-recommendation question that depends on circumstances no tool can see. What it can do is describe complexity: number of positions, number of currencies, how much sits in single names versus funds.
Measured complexity, Demo portfolio: 10 holdings, two currencies (USD 5.90% and EUR 4.35% of total value), 33.24% in two funds and 44.79% in six individual stocks, plus a commodity position at 11.6%.
Source: Demo portfolio › Diversification
Would removing one holding improve my portfolio?
Ask can compute exactly what changes if a position is removed: new weights, new yield, new income total, new sector split, shown before and after side by side. It stops there, because whether that constitutes an improvement is a judgement about your objectives.
Worked example: remove JEPI from the Demo portfolio and forward annual income falls from $3,615.87 to roughly $1,553, portfolio yield drops from 2.1% to about 0.96%, and the largest single weight becomes VOO at 21.7% rather than 18.45%.
Source: Demo portfolio › Dividends, computed
Dividends & passive income
Forward income, yield on cost, the payment calendar, and where the cash actually comes from.
Covers searches for dividend income calculator, how much dividend income will I get, monthly dividend income
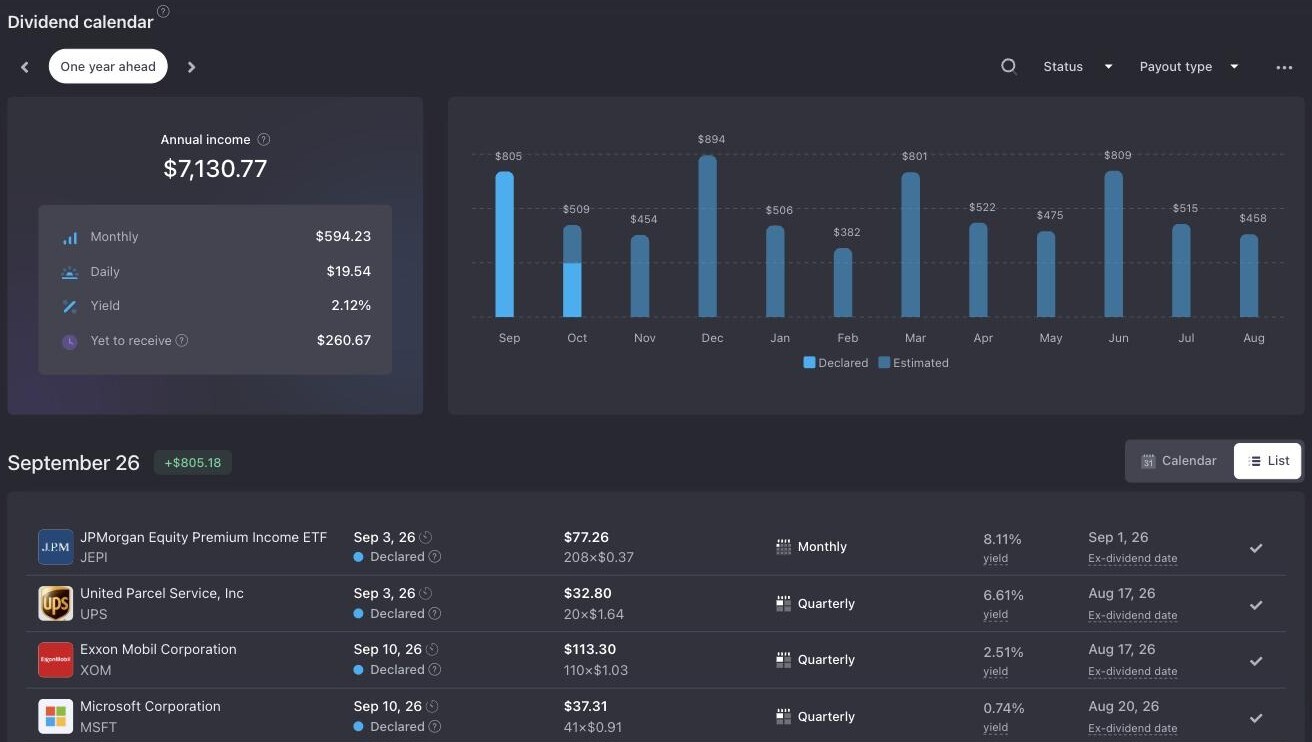
How much dividend income will I receive in the next 12 months?
Forward income is the sum of each holding's declared or expected distribution multiplied by the shares you actually hold, adjusted for known increases and for the payment calendar. It is not the trailing figure, and it is not the yield multiplied by portfolio value.
Demo portfolio, next 12 months: $3,615.87, an average of $301.32 a month. The trailing 12 months came in slightly higher at $3,974.38, because the two figures cover different payment dates and different share counts.
Source: Demo portfolio › Dividends
What is my portfolio's dividend yield?
Three yields exist and they answer different questions. Current yield divides forward income by today's value. Pre-tax yield ignores withholding. Yield on cost divides the same income by what you originally paid, so it rises over time even if nothing changes.
Demo portfolio: 2.1% current yield, 2.34% before tax, 3.5% yield on cost. The gap between 2.1% and 3.5% is the whole point of the cost-basis view: it reflects price appreciation since purchase, not a better income stream today.
Source: Demo portfolio › Dividends
Which holdings pay most of my dividends?
Income concentration and capital concentration are different measures, and the gap between them is usually the more interesting number. A high-yield position can be a small slice of capital while supplying most of the cash.
Demo portfolio income split: JEPI 57.5% ($2,062.52), Volkswagen 15.1% ($542.95), Home Depot 9.4% ($335.52), VOO 9.2% ($330.55), Starbucks 3.1%, Costco 2.9%, Apple 2.7%, S&P Global 0.05%. JEPI supplies 3.9x more income than its 14.8% capital weight would imply.
Source: Demo portfolio › Dividends
What dividends will I get each month?
Monthly income is rarely level. Ask returns the forward calendar month by month, which exposes the quarterly clustering most portfolios inherit from US payers and the annual lump many European holdings pay in a single month.
Demo portfolio forward calendar: Sep $358, Oct $162, Nov $235, Dec $331, Jan $192, Feb $234, Mar $327, Apr $189, May $280, Jun $891, Jul $174, Aug $244. June is 5.5x July, driven by Volkswagen's annual payment.
Source: Demo portfolio › Dividends
How much did I actually receive in dividends over the last 12 months?
Received income is read from your transaction history rather than modelled: actual cash, on actual dates, in the currency it arrived in. This is the figure that reconciles with a broker statement; the forward figure will not.
Demo portfolio, trailing 12 months to Sep 2026: $3,974.38 received. Month by month it ranged from $194 to $987, with the June peak again reflecting the annual European payment rather than a change in holdings.
Source: Demo portfolio › Dividends
When will my dividend income reach $1,000 a month?
The answer needs four inputs: today's income, your contribution rate, an assumed dividend growth rate, and whether distributions are reinvested. Ask asks for the ones you have not supplied and shows the date each assumption produces, rather than a single confident number.
Demo portfolio arithmetic from $301.32 a month: with distributions reinvested, 6% annual dividend growth and no new money, monthly income passes $1,000 in roughly year 20. Adding $500 a month at the same yield shortens it to roughly year 11. Both are arithmetic, not forecasts.
Source: Demo portfolio › Dividends, computed
How much do I need to invest to add $10 a month in passive income?
Extra monthly income divided by the yield of what you buy gives the capital required. The sensitivity to yield is the part most people underestimate: the same $10 a month costs four times as much at a 1% yield as at 4%.
To add $10 a month ($120 a year): about $1,548 at JEPI's 7.75% yield on cost, about $3,800 at Home Depot's 3.16%, about $5,455 at VOO's 2.2%, about $12,500 at Apple's 0.96%. These are yield calculations, not suggestions about what to buy.
Source: Demo portfolio › Common, computed
Is my dividend income growing?
Income growth has two sources that are worth separating: organic growth, where companies raise their distributions, and contributed growth, where you buy more shares. A portfolio can show rising income while every holding freezes its dividend.
Demo portfolio five-year dividend growth by holding: Costco 13.21%, Home Depot 7.15%, VOO 7.37%, Starbucks 6.15%, Volkswagen 5.53%, S&P Global 5.32%, Apple 4.35%, JEPI 2.14%. The largest income source has the slowest growth rate.
Source: Demo portfolio › Common
What is yield on cost and why is mine higher than my yield?
Yield on cost measures today's income against the price you originally paid. It rises automatically whenever a holding appreciates or raises its distribution, and it never falls when prices rise, which is why it flatters portfolios held a long time.
Demo portfolio: 2.1% current yield against 3.5% yield on cost. At the holding level Apple shows 0.29% current and 0.96% on cost, Costco 0.59% and 1.63%. The spread is the price gain since purchase, not extra income.
Source: Demo portfolio › Dividends
How sustainable is my dividend income?
Sustainability is assessed from payout ratios, distribution history, and how much of total income depends on a single payer or a single strategy. Ask reports the dependency; it does not forecast a cut or advise a change.
Demo portfolio: 57.5% of income comes from one covered-call ETF whose distribution varies with option premiums, and a further 15.1% from a single European carmaker paying once a year. Two payers therefore account for 72.6% of forward income.
Source: Demo portfolio › Dividends
Projections & future value
How a projection is built, which assumption drives the result, and why the range matters more than the number.
Covers searches for how much will my portfolio be worth in 10 years, portfolio projection calculator
How much will my portfolio be worth in 10 years?
There is no single answer, so Ask returns three: a bearish, neutral and bullish path built from a return assumption you can see and change. The spread between them is the honest content of the answer, because a single number would imply precision that does not exist.
Demo portfolio, starting at $190,003.31 with no further contributions: about $312,900 at 5% a year, about $381,800 at 7%, about $465,800 at 9%. Adding $500 a month lifts the same three paths to roughly $390,600, $468,400 and $562,500.
Source: Demo portfolio › computed
Break my projection into bearish, neutral and bullish scenarios
One projection, three assumptions. Each scenario uses a different compound return, holds contributions constant, and is drawn as a path rather than a single endpoint, so you can see the point at which the three diverge.
On the Demo portfolio the three paths are within $30,000 of each other after three years and about $153,000 apart after ten. Nearly all of the uncertainty accrues in the back half of the period, which is why short-horizon projections look deceptively reliable.
Source: Demo portfolio › computed
What happens to my projection if I add $500 a month?
Contributions and compounding pull in different directions over different horizons: new money dominates the first few years, compounding dominates the last. Ask shows the two contributions to the final figure separately.
Demo portfolio at 7% for 10 years: $381,842 with no contributions, $468,385 with $500 a month. Of the $86,543 difference, $60,000 is the money you put in and about $26,500 is growth on it.
Source: Demo portfolio › computed
How long until my portfolio doubles?
Doubling time depends only on the compound rate, not on the starting amount, which is why the answer is the same for a $5,000 and a $500,000 portfolio. Contributions shorten it, and Ask reports both versions.
From $190,003.31 with no contributions: about 14.2 years at 5%, 10.2 years at 7%, 8.0 years at 9%. The Demo portfolio has in fact already roughly doubled once: invested capital of $95,312.13 now stands at $190,003.31.
Source: Demo portfolio › Common, computed
Run a Monte Carlo analysis on my portfolio
A Monte Carlo run replaces a single assumed return with thousands of randomly sequenced ones, and reports the distribution of outcomes instead of a line. Its value is that it exposes sequence risk, because the same average return can end very differently depending on the order.
Applied to a portfolio like the Demo one, the useful output is not the median but the spread: the gap between the 10th and 90th percentile outcome, and the share of paths that fail to reach a stated target. Assumptions are shown alongside the result.
Source: Method
What will my portfolio be worth if I keep adding €2,000 a month for 20 years?
Ask handles recurring contributions in any supported currency, at any interval, and can apply them from a future start date. The result is shown as a path with the contributed total marked separately from growth.
At 7% a year, €2,000 a month for 20 years contributes €480,000 and produces roughly €1.04m in total, meaning about 54% of the final figure is money you deposited, not investment return. At 5% the contributed share rises to about 62%.
Source: Computed
Does my projection account for dividends and reinvestment?
Only if you say so, and Ask states which mode it used. Price-only, dividends-taken-as-cash and full reinvestment produce materially different paths, and conflating them is the most common error in DIY projections.
Demo portfolio over 10 years at a 6% price return: roughly $340,000 with dividends taken as cash plus $36,000 of cash received, against roughly $384,000 with the same dividends reinvested at a 2.1% yield, a gap of about $8,000 in end value.
Source: Computed
How much should I invest monthly to reach $100,000?
This is the projection run backwards: fix the target and the date, solve for the contribution. Ask returns the monthly figure for each return assumption, so you can see how much of the plan depends on markets rather than on you.
Starting from zero to reach $100,000 in 10 years: about $644 a month at 5%, $577 at 7%, $516 at 9%. Starting from $50,000 already invested, the same target needs about $141, $50 or nothing at all at those rates.
Source: Computed
What would my portfolio be worth in 30 years?
Long horizons magnify the assumption rather than the starting balance, so Ask widens the reported range rather than narrowing it. At 30 years the difference between a 5% and a 9% assumption is larger than the entire starting portfolio.
Demo portfolio, no contributions: about $821,000 at 5%, roughly $1.45m at 7% and about $2.52m at 9%. The $1.7m spread is nine times the $190,003.31 the portfolio is worth today.
Source: Computed
How likely am I to reach my target?
Probability language requires a model and a set of assumptions, and Ask shows both. It reports how a target is affected by contribution size, time and assumed return, and it is explicit that a probability is a property of the model, not a prediction about markets.
Demo portfolio against a $500,000 target in 10 years: unreachable at 5% and 7% without contributions, reached at 9% only with roughly $250 a month added. The same target at 15 years needs no contributions at 7%.
Source: Computed
Goals, FIRE & “am I on track?”
Turning a target and a date into a required rate, a required contribution, and a crossover month.
Covers searches for am I on track to retire early, FIRE progress calculator, passive income coverage
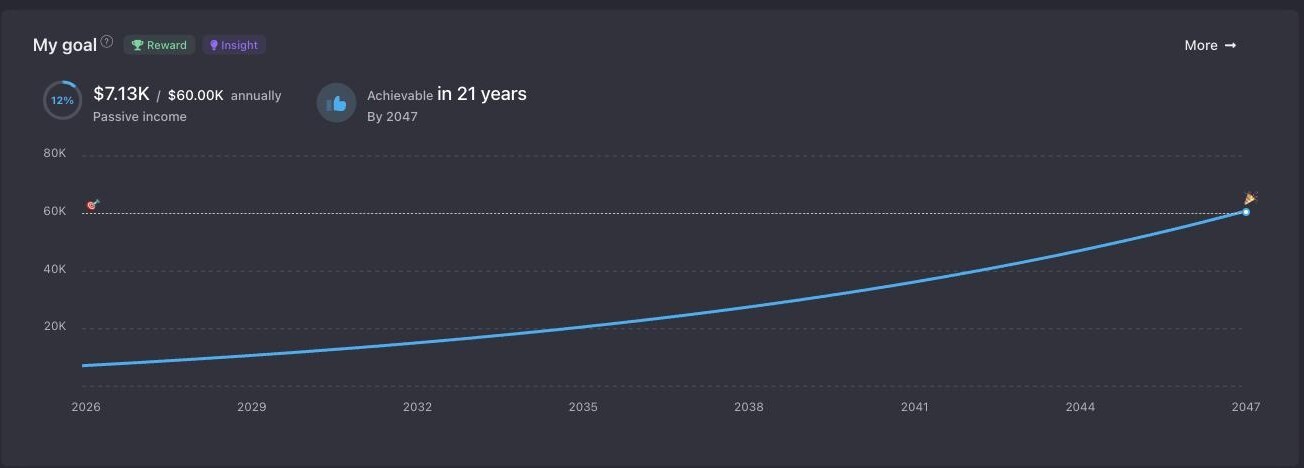
Am I on track for my goal?
On track is measured against a goal you define: a capital figure, an income figure, or a date. Ask compares the required compound rate implied by your goal with the rate your portfolio and contributions currently produce, and reports the gap in both directions.
Demo portfolio example: reaching $1,000,000 from $190,003.31 in 15 years requires about 11.7% a year with no contributions. The portfolio's realised IRR since inception is 11.9%, and 8.68% on current holdings, so the goal sits between the two measured rates.
Source: Demo portfolio › Common, computed
When will my passive income cover my expenses?
The coverage question needs a monthly expense figure from you. Ask then reports the crossover month under your contribution and dividend-growth assumptions, and shows how sensitive that date is to each input separately.
Demo portfolio at $301.32 a month of forward income: covering $2,000 a month of expenses requires roughly 6.6x the current income. With distributions reinvested and 6% dividend growth, that is about 26 years with no new money, or about 13 years with $1,000 a month added.
Source: Demo portfolio › Dividends, computed
How much capital do I need to retire on $5,000 a month?
Required capital is the annual figure divided by the withdrawal or yield rate you assume, and the assumption dominates the answer. Ask shows the figure across a range of rates rather than picking one for you.
$5,000 a month is $60,000 a year. That needs $1.5m at a 4% rate, $1.2m at 5%, $857,000 at 7% and $750,000 at 8%. Higher assumed rates shrink the target and raise the risk that the assumption fails. The tool states the trade-off without resolving it.
Source: Computed
What return do I need to hit my target by a specific year?
This is the required-rate calculation, and it is the most useful reality check available. Ask solves for the compound rate your goal implies, then places that rate next to what the portfolio has actually delivered.
Demo portfolio to $4,000,000 by 2039 (13 years) from $190,003.31: about 26.4% a year with no contributions, falling to about 17.1% with $3,000 a month added. Realised IRR to date is 11.9%.
Source: Computed
How would shifting part of my portfolio toward income affect my timeline?
Ask recalculates the income and growth paths for a hypothetical weight change and shows both, because the trade is almost always income now against capital later. It presents the two paths; it does not say which to prefer.
Demo portfolio, moving 20% of value from the lowest-yielding names into holdings yielding 4%: forward income rises from about $3,616 to roughly $5,000 a year, while the projected 10-year value at a 7% total return is essentially unchanged, because the shift moves return between the two columns rather than creating it.
Source: Computed
Am I saving enough each month?
Enough is defined only by a goal and a date. Ask converts the goal into a required monthly contribution at several return assumptions, and compares it with what you actually contribute.
Demo portfolio toward $500,000 in 10 years: about $766 a month at 5%, $445 at 7% and $141 at 9%. The spread of $625 between the optimistic and pessimistic cases is the part of the plan that markets control rather than you.
Source: Computed
What is my FIRE number and how close am I?
A FIRE number is annual spending multiplied by the inverse of a chosen withdrawal rate. Ask computes it from your figure, shows current progress as a percentage, and reports the implied date under your contribution rate, flagging that the withdrawal rate is an assumption, not a law.
At $40,000 a year of spending and a 4% rate, the target is $1,000,000. The Demo portfolio's $190,003.31 is 19% of the way there; at 7% with $1,500 a month added, the arithmetic reaches it in roughly 16 years.
Source: Computed
Can I retire in three years on this portfolio?
Ask will show the arithmetic: projected value at your retirement date, sustainable withdrawal at several rates, and how long the capital lasts at your spending level. It will not answer yes or no, because that is a personal recommendation.
Demo portfolio in three years at 7%: about $232,800. At a 4% withdrawal that supports roughly $776 a month before tax; at 5%, roughly $970. Those are arithmetic outputs to take to a qualified adviser, not a conclusion.
Source: Computed
How does a withdrawal change my projection?
Withdrawals reverse compounding, and the damage depends heavily on when they start. Ask models a fixed annual or monthly withdrawal against the same return assumptions and reports the year the balance peaks and the year it depletes, if it does.
Demo portfolio with a $45,000 annual withdrawal and no deposits: at 7% the balance falls below zero in roughly year 5; at 9%, roughly year 6. At a $12,000 annual withdrawal the portfolio still grows at both rates.
Source: Computed
What happens to my goal if I stop contributing for a year?
Ask reruns the plan with a contribution pause and reports the delay in months rather than the change in end value, because a date is what most goal questions are really about.
Demo portfolio toward $500,000 at 7% with $500 a month: pausing contributions for 12 months pushes the target date out by roughly 16 months, more than the pause itself, because the missed deposits also miss their compounding window.
Source: Computed
Performance & benchmarks
Time-weighted, money-weighted, and the benchmark gap: three answers to one question about returns.
Covers searches for portfolio vs S&P 500, portfolio benchmark comparison, time weighted vs money weighted return
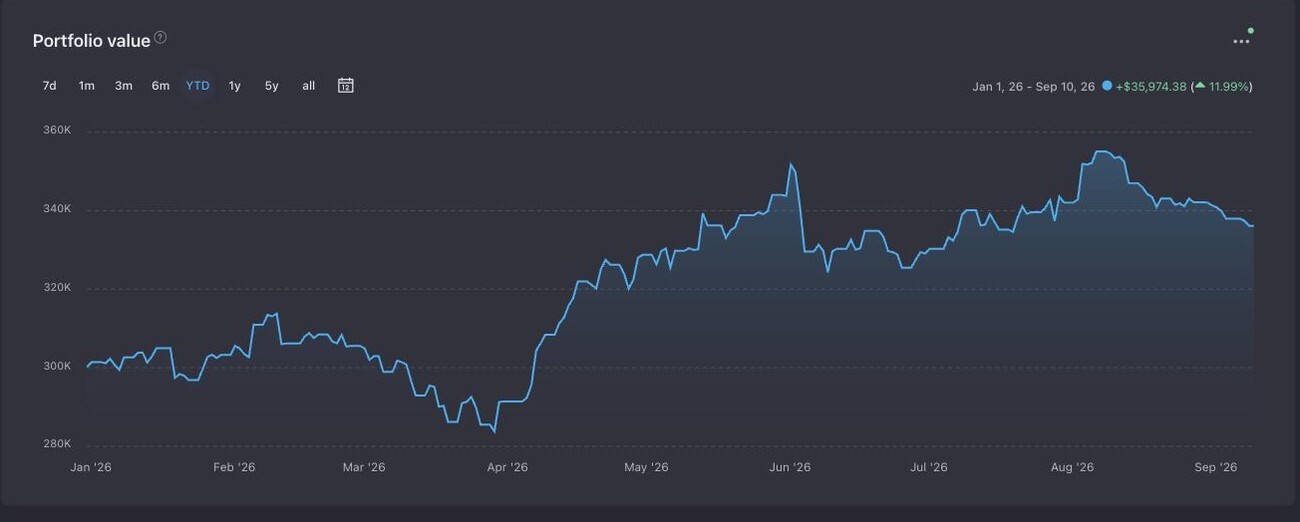
How is my portfolio performing versus the S&P 500?
A fair comparison needs the same measure on both sides. Ask uses time-weighted return, which strips out the effect of your deposits and withdrawals, and shows the money-weighted figure separately because that is what your account actually earned.
Demo portfolio: lifetime time-weighted return of 99.35% against SPY's 152.47% over the same period, a shortfall of 53.12 percentage points. Over the trailing year the portfolio gained $9,196.66 against the index's $29,389.63 on the same capital, a gap of $20,192.97 or 10.63%.
Source: Demo portfolio › Metrics, Growth
What is the difference between time-weighted and money-weighted return?
Time-weighted return measures the holdings; money-weighted return (IRR) measures your decisions, including when you put money in. A well-timed deposit before a rally raises IRR without any holding performing better.
Demo portfolio: 11.9% IRR against 99.35% cumulative time-weighted return since inception. The IRR figure also splits, 8.68% for current holdings versus 11.9% overall, which isolates the contribution of positions already sold.
Source: Demo portfolio › Common, Metrics
Why is my portfolio underperforming the index?
Attribution answers this by decomposing the gap into its sources: which positions dragged, which helped, how much cash sat idle, and how much came from currency. Ask reports the decomposition rather than diagnosing a cause.
Demo portfolio: the largest measured drags on the benchmark gap are a 10.4% average cash weight earning no equity return, an 11.6% commodity position that does not track equities, and a single position down 20.61%. Apple's +237.08% is the largest offsetting contributor.
Source: Demo portfolio › Common, Diversification
Which of my holdings performed best and worst this year?
Ask ranks holdings by contribution to portfolio return, not by percentage change, since a 200% gain on a 0.1% position moves almost nothing. Both views are shown, because they answer different questions.
Demo portfolio by percentage: Apple +237.08%, Costco +188.28%, VOO +145.01%, Gold +122.05% at the top; S&P Global −20.61% and Volkswagen −11.72% at the bottom. By dollar contribution the order changes: Apple's $24,079.45 and VOO's $21,758.21 dominate.
Source: Demo portfolio › Common
How did my portfolio do this year, and which trades made the difference?
Ask separates return into three sources: price movement on holdings you kept, realised gains on positions you closed, and income received, so that “what made the difference” has a numerical answer rather than a narrative one.
Demo portfolio over the trailing year: +$8,467.25, or 4.66%. Income accounted for $3,974.38 of that, meaning roughly 47% of the year's total return arrived as dividends rather than price appreciation.
Source: Demo portfolio › Growth, Dividends
Can I compare my portfolio to a different benchmark?
Yes: an index, an ETF, or a portfolio of your own construction. Comparing against a portfolio that matches your actual asset mix is usually more informative than comparing a 24% cash-and-gold portfolio to a pure equity index.
The Demo portfolio holds 76% stocks, 11.6% commodities and 10.4% cash. Measured against SPY it trails by 53.12 points on time-weighted return; a blended benchmark reflecting that actual mix produces a materially smaller gap.
Source: Demo portfolio › Metrics, Diversification
How far is my portfolio off its all-time high?
Drawdown from peak is measured on portfolio value adjusted for cash flows, so a deposit does not disguise a decline and a withdrawal does not manufacture one. Ask reports current drawdown, the deepest historical drawdown and how long recovery took.
This is read directly from your own valuation history rather than modelled, which is why it needs synced transactions rather than a snapshot of today's holdings.
Source: Method
How much of my return came from dividends rather than price?
Total return splits cleanly into income and capital appreciation, and the split varies enormously between portfolios. Ask reports both, in currency and as a share of the total.
Contrast three real portfolios: the Demo portfolio earned $3,974.38 of income on a $190,003.31 base (2.1%), Ryne's Portfolio $4,704.41 on $143,865.77 (3.27%), and Utbyttereisen NOK 548,166.76 on NOK 7.83m (7.81%).
Source: Public portfolios
What is my portfolio's IRR?
IRR is the annualised rate that makes all your cash flows balance against today's value, the closest thing to “what my money actually earned”. It is sensitive to contribution timing, which is a feature rather than a flaw.
Three public portfolios show the range: the Demo portfolio at 11.9% (8.68% on current holdings), Ryne's Portfolio at 13.43% (8.39% current), and Utbyttereisen at 42.21% (14.99% current). The gap between the two figures in each case reflects positions that have already been closed.
Source: Public portfolios
Why does my broker show a different return than Snowball Analytics?
Almost always a definition difference rather than an error: brokers usually report simple return on current holdings, frequently exclude dividends already withdrawn, and rarely use time-weighting. Ask can show each definition side by side so the discrepancy resolves.
On the Demo portfolio the same period supports at least four defensible figures: +99.3% simple profit, 99.35% time-weighted, 11.9% annualised IRR and 8.68% IRR on current holdings only.
Source: Demo portfolio › Common, Metrics
Risk & volatility
Beta, Sharpe, Sortino and drawdown, and what each one does and does not tell you about risk.
Covers searches for portfolio risk analysis, portfolio beta, sharpe ratio, portfolio volatility
How risky is my portfolio?
Risk is reported as several separate measures because they disagree with each other, and the disagreement is informative. Ask returns volatility relative to the market, risk-adjusted return, downside-only risk-adjusted return, and concentration.
Demo portfolio: beta 0.788 (less volatile than the market), Sharpe ratio 0.618, Sortino ratio 0.925, weighted P/E 33.9x, and 50.99% of value in three positions. Lower volatility and modest risk-adjusted return coexist here.
Source: Demo portfolio › Metrics
What is my portfolio's beta?
Beta compares your portfolio's movement to the market's. Below 1 means it has historically moved less than the market; above 1, more. It describes past co-movement, not future loss, and says nothing about company-specific risk.
Demo portfolio beta: 0.788. That figure is pulled down by the 10.4% cash weight and the 11.6% gold position, both of which move independently of equity indices.
Source: Demo portfolio › Metrics
What is a good Sharpe ratio for a portfolio?
Sharpe measures return per unit of total volatility. Conventional reference points put above 1 as solid and above 2 as strong, but the ratio is only comparable between portfolios measured over the same period against the same risk-free rate.
Demo portfolio: Sharpe 0.618, which Snowball Analytics flags as requiring attention against the SPY comparison over the same window. The flag is a measurement note, not a recommendation to change anything.
Source: Demo portfolio › Metrics
What is the Sortino ratio and why is it different from Sharpe?
Sortino counts only downside volatility, on the reasoning that upside swings are not a risk anyone wants protection from. A portfolio with sharp gains and mild losses scores better on Sortino than on Sharpe.
Demo portfolio: Sortino 0.925 against Sharpe 0.618. The higher Sortino indicates that a meaningful share of the portfolio's total volatility came from upward moves rather than drawdowns.
Source: Demo portfolio › Metrics
Which holding adds the most risk for the least return?
Ask ranks holdings by contribution to portfolio volatility against their contribution to return. The output is a ranking with the inputs shown: position size, realised return, and how the holding moves relative to the rest.
On the Demo portfolio the two negative contributors are S&P Global (−20.61%, but only 0.11% of value, so its portfolio impact is negligible) and Volkswagen (−11.72% on a 4.77% weight, with an annual single-payment dividend adding timing lumpiness).
Source: Demo portfolio › Common
What happens to my portfolio in a market crash?
Ask applies a stress scenario you specify, such as a percentage index fall, using each holding's measured sensitivity, and reports the modelled value change. It is a sensitivity calculation based on past relationships, not a forecast.
Demo portfolio at beta 0.788 in a modelled 30% index fall: roughly −23.6% on the equity-sensitive portion, with the 10.4% cash position unaffected and the 11.6% gold position moving on its own dynamics rather than with equities.
Source: Demo portfolio › Metrics, computed
How much of my portfolio is in cash and is that a risk?
Cash carries no market risk and full inflation risk, and Ask reports the weight and the drag rather than a judgement. Cash drag is calculable: the weight multiplied by the return it did not earn.
Demo portfolio: $19,485.09 in cash, 10.26% of value, against a 15% cash target. Split by currency that is USD 5.90% and EUR 4.35% of total portfolio value.
Source: Demo portfolio › Common, Diversification
Is my portfolio more volatile than the market?
Ask compares realised portfolio volatility with the benchmark's over the same window, and shows where the volatility originates, which positions contribute most to the total, weighted by size.
Demo portfolio: measured as less volatile than the market at beta 0.788. For contrast, Utbyttereisen holds 21.7% in a single shipping stock and 38.15% in industrials, a very different volatility profile.
Source: Public portfolios
What is my portfolio's weighted P/E?
Weighted P/E aggregates each holding's earnings multiple by its portfolio weight, giving one valuation figure for the whole book. It is a description of what you own, not a signal about what happens next.
Demo portfolio: 33.9x, on a scale Snowball Analytics plots from 0x to 70x. The figure is lifted by large weights in Apple and Costco; funds and the commodity position are handled separately in the calculation.
Source: Demo portfolio › Metrics
Can my portfolio go to zero?
A diversified portfolio of listed equities and funds going to zero requires every holding to fail simultaneously. Ask answers this by showing what share of value sits in single securities versus pooled funds, and what share is cash.
Demo portfolio: 44.79% in six individual stocks, 33.24% in two broad funds, 11.6% in a physical commodity, 10.26% in cash. The largest single-company exposure is Apple at 17.74%.
Source: Demo portfolio › Common
Concentration, diversification & overlap
Position, sector, currency and look-through fund exposure, measured at four levels that rarely agree.
Covers searches for is my portfolio too concentrated, ETF overlap tool, portfolio diversification checker
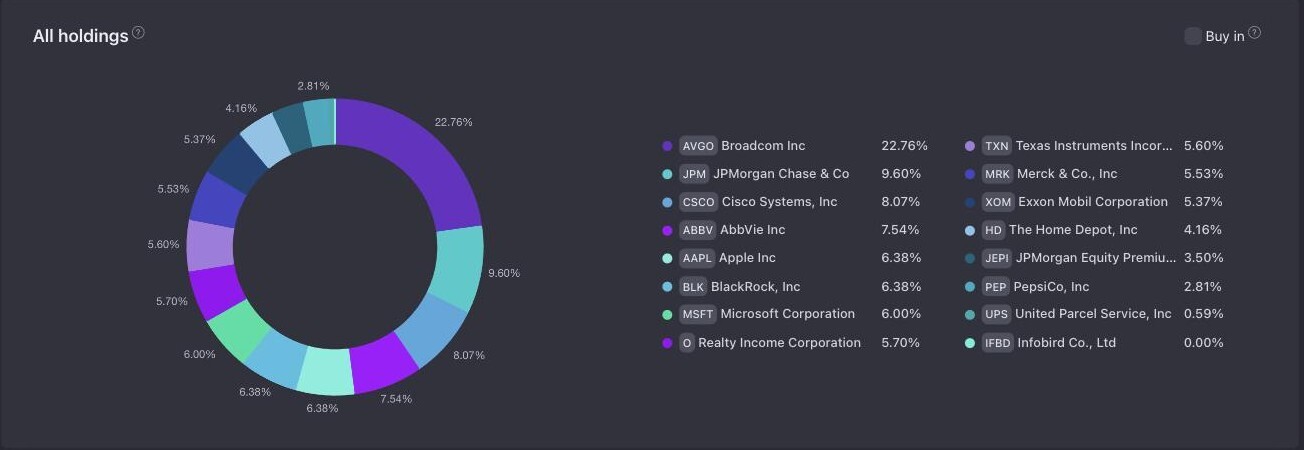
Where am I most concentrated right now?
Concentration is measured at four levels that rarely agree: single position, sector, country and currency. A portfolio can look diversified by holding count and be highly concentrated once fund holdings are looked through.
Demo portfolio: VOO 18.45%, Apple 17.74%, JEPI 14.80%, Gold 11.60%, Costco 9.41%. The top three are 50.99% and the top five 72.0% of total value. Two of those three are funds, so the look-through concentration differs again.
Source: Demo portfolio › Diversification
Is my portfolio too concentrated?
There is no universal threshold, and Ask does not invent one. Commonly cited rules of thumb sit between 5% and 10% for a single position, but the figure that matters is the one you set in your own plan. Ask reports the measurement against your stated limit.
Demo portfolio measured against a 10% single-position rule: VOO, Apple, JEPI and Gold all exceed it, together making up 62.59% of value. Against a 20% rule, none do.
Source: Demo portfolio › Diversification
Do any of my holdings overlap?
Overlap is invisible until funds are looked through to their underlying holdings. Two ETFs with different names and different tickers can hold the same companies at similar weights, and a direct stock position can duplicate a fund's largest constituent.
Demo portfolio: VOO tracks the S&P 500, whose largest constituent is Apple, which is also held directly at 17.74% of the portfolio. the Snowball Analytics X-Ray Funds view resolves the combined exposure rather than counting them as two separate positions.
Source: Demo portfolio › Diversification › X-Ray Funds
How much of my portfolio is really in one company after looking through my ETFs?
Look-through exposure adds your direct holding to your share of each fund's position in the same company. It is routinely several points higher than the position list suggests, and it is the number concentration limits should be applied to.
In the Demo portfolio, Apple appears as a 17.74% direct position and again inside VOO (18.45% of the portfolio) and inside JEPI's equity sleeve. The X-Ray view combines all three into one exposure figure.
Source: Demo portfolio › Diversification › X-Ray Funds
How many holdings should I have?
Ask reports what your current count implies for concentration and monitoring load rather than prescribing a number. Research on diversification benefit is usually cited in the 20 to 30 holding range for single stocks, but fund positions change the arithmetic completely.
Three live portfolios for scale: the Demo portfolio at 10 holdings with 50.99% in three, Ryne's Portfolio at 21 holdings with its largest at 14.2%, and Utbyttereisen at 18 holdings with 21.7% in one name.
Source: Public portfolios
Am I diversified enough?
Enough is defined by your plan, so Ask reports the spread across every dimension it can measure: position, sector, asset class, currency and region, and it marks which of them your own target allocation covers.
Demo portfolio spread: asset classes at stocks 76%, commodities 11.6%, cash 10.4%, other 2%; sectors led by funds and multi-sector exposure at 33.25%, then IT 17.74% and consumer discretionary 13.68%; currencies USD and EUR.
Source: Demo portfolio › Diversification
What sectors is my portfolio missing?
Ask compares your sector weights with a reference index and lists the gaps in percentage-point terms. It stops at the description, because which gaps are worth closing depends on a strategy the tool cannot see.
Demo portfolio direct sector weights: IT 17.74%, consumer discretionary 13.68%, consumer staples 9.41%, communication services 3.96%, financials 0.11%. Healthcare, energy, utilities, real estate, materials and industrials have no direct weight at all; some exposure arrives indirectly through VOO.
Source: Demo portfolio › Diversification
How concentrated is my dividend income?
Income concentration is measured separately from capital concentration because they diverge sharply in income-oriented portfolios. The relevant question is how many payers would need to cut before the income plan breaks.
Demo portfolio: one holding supplies 57.5% of forward income from 14.8% of capital, and two supply 72.6%. For comparison, Ryne's Portfolio spreads $4,704.41 of annual income across 21 payers, with the largest at roughly 13%.
Source: Demo portfolio › Dividends
What percentage of my portfolio is in REITs, BDCs or a specific group?
Ask can group holdings by any attribute it stores: asset type, sector, country, currency, account, or a custom group you define, and return the weight of that group in both percentage and currency terms.
Grouping works in both directions: the Demo portfolio's own structure uses custom groups (Funds, Stocks, Cash, Commodities) with target weights of 45%, 30%, 15% and 10% attached to each.
Source: Demo portfolio › Common
How much currency risk am I carrying?
Currency exposure comes from where a holding is listed, where it earns, and what your reporting currency is. Those are three different things. Ask reports how your holdings split by currency, with every value shown in your reporting currency.
Demo portfolio: reported in USD, with a EUR cash position at 4.35% of value and a euro-listed equity at 4.77%. Utbyttereisen reports entirely in NOK, so the same holdings would produce different returns for a USD-based investor.
Source: Public portfolios
Allocation, rebalancing & what-if
Drift from target, the cost of closing it, and the arithmetic behind a hypothetical trade.
Covers searches for portfolio rebalancing calculator, target allocation drift, what if I buy
How far has my portfolio drifted from my target allocation?
Drift is the difference between the weights you set and the weights markets produced. Ask reports it per group in percentage points and in the currency amount required to close the gap.
Demo portfolio, actual against target: funds 33.24% against 45%, stocks 44.79% against 30%, cash 10.26% against 15%, commodities 11.6% against 10%. Closing the stock gap alone involves roughly $28,000 of value.
Source: Demo portfolio › Common
What would rebalancing back to my targets look like?
Ask computes the trades that would restore your stated targets: the amount per group, in your currency, and shows the resulting yield and sector change. It presents the arithmetic of a rebalance you have asked about; it does not propose one.
Demo portfolio: restoring the 45/30/15/10 target from today's 33.24/44.79/10.26/11.6 involves moving roughly $22,300 toward funds and roughly $9,000 toward cash, with the stock group reduced by about $28,100.
Source: Demo portfolio › Common, computed
I have $1,300 to invest: what does each option do to my portfolio?
A fixed amount and several candidate uses for it. Ask models the outcome of each option you name: resulting weights, income change, sector change, side by side. Choosing between them is yours; the tool supplies the arithmetic for each.
$1,300 into the Demo portfolio at different yields: about $100 a year of additional income at 7.75%, $41 at 3.16%, $29 at 2.2%, $12 at 0.96%. Portfolio weights move by roughly 0.7 percentage points in each case.
Source: Demo portfolio › computed
What if I sell one holding and buy another: how does that change things?
Ask recalculates the whole portfolio under the hypothetical: new weights, new forward income, new sector and currency splits, and the realised gain or loss the sale would crystallise. All outputs, no verdict.
Worked example on the Demo portfolio: selling the 0.11% S&P Global stub realises a $53.12 loss and changes portfolio yield by less than 0.01 points, because the position is too small to move any aggregate measure.
Source: Demo portfolio › computed
Should I dollar-cost average or invest a lump sum?
Ask will model both paths against the same return assumption and show the difference, including the amount left uninvested during a phased entry. Which suits you depends on factors that sit outside the data: tax, timing and temperament.
On $12,000 at a 7% assumed annual return: a lump sum earns a full year of growth on the whole amount, while spreading it over 12 months leaves an average of about half the capital uninvested, a gap of roughly $420 in year one under that single assumption.
Source: Computed
How much of my portfolio is one holding, in dollar terms?
Simple, and asked constantly. Ask converts any weight question into both a percentage and a currency amount, at any level: holding, sector, group, account or currency.
Demo portfolio: Apple 17.74% is $33,700.00, VOO 18.45% is $35,051.50, JEPI 14.80% is $28,115.00, Gold 11.60% is $22,048.00, and 8% of the Apple position would be $2,696.
Source: Demo portfolio › Common
What would my portfolio look like with a different asset split?
Ask can model an alternative portfolio you describe, for example a two-fund split, and compare it against your current one on yield, cost, concentration and historical return over the same window.
The comparison is like-for-like on the same dates and the same benchmark, so differences reflect the allocation rather than the measurement period. Assumptions used are listed with the result.
Source: Method
How do I reduce the number of holdings without changing my exposure?
Ask maps which positions overlap in sector, factor or underlying constituents, and shows what each consolidation would do to weights, income and cost. The consolidation decision stays with you.
This is a look-through question: in the Demo portfolio, VOO's S&P 500 constituents already contain Apple, Costco, Home Depot, Netflix, Starbucks and S&P Global, six of the eight direct equity positions.
Source: Demo portfolio › Diversification › X-Ray Funds
What is my average cost per share for a holding?
Read from your transaction history, not estimated: every buy, every fractional purchase, adjusted for splits and for any dividend reinvestment that added shares.
Demo portfolio examples: Apple 100 shares at an average $101.56 against $337.00 today, Costco 20 at $325.53 against $893.93, Volkswagen 100 at $146.05 against $90.58, VOO 50 at $300.10 against $701.03.
Source: Demo portfolio › Common
Can I model a phased plan with specific dates and amounts?
Yes. Ask accepts a schedule: amounts, dates, and a target allocation to apply them to. It then projects the resulting path, including the income the phased capital generates as it is deployed.
Outputs are shown as a timeline with the contributed total separated from growth, so the share of the result that comes from deposits rather than markets is visible at every point.
Source: Method
Taxes, fees, currency & costs
Withholding, cost basis, expense ratios and currency effects: the costs that never appear on a statement.
Covers searches for dividend withholding tax, portfolio cost basis, expense ratio impact
How much dividend tax am I paying?
Ask reports the gap between gross and net distributions from your own records, which is where withholding shows up. It reports what was actually deducted. It does not work out what you owe or apply your jurisdiction's rules.
Demo portfolio: 2.34% yield before tax against 2.1% after, a difference of about 0.24 percentage points, or roughly $410 a year on the current value. Your own rate depends on residence, account type and treaty, none of which the tool assumes.
Source: Demo portfolio › Dividends
What is my cost basis and unrealised gain?
Cost basis is built from your actual transactions, including fractional purchases, dividend reinvestments and fees where recorded. Unrealised gain is today's value minus that basis, per holding and in total.
Demo portfolio: $95,312.13 invested against $190,003.31 today, an unrealised gain of $94,691.17 (99.3%). At the holding level Apple shows $10,156.50 against $33,700.00, while Volkswagen shows $14,605.42 against $9,058.16.
Source: Demo portfolio › Common
What are my fund fees costing me?
Expense ratios are charged silently inside fund prices, so they never appear on a statement. Ask multiplies each fund's ratio by your position value to give the annual cost in currency, which is the form that makes the number legible.
On a portfolio holding $63,166.50 in funds, the difference between a 0.03% and a 0.35% average expense ratio is roughly $202 a year, and it compounds against the balance for as long as the position is held.
Source: Demo portfolio › Common, computed
How much cash am I holding, and in which currencies?
Cash balances are part of the portfolio, so Ask reports them with the holdings: the amount in each currency and its share of total value, shown in your reporting currency.
Demo portfolio: $19,485.09 of its $190,003.31 is cash, held across two currencies, with the EUR cash balance at 4.35% of value.
Source: Demo portfolio › Common
Which of my holdings have unrealised losses?
Ask lists positions below cost with the amount and percentage, read from your transaction history. Whether anything should be done about them is a tax and planning question for a qualified professional.
Demo portfolio: two positions sit below cost: Volkswagen at −$1,712.25 (−11.72%) and S&P Global at −$53.12 (−20.61%). The remaining eight are above cost.
Source: Demo portfolio › Common
Can Ask tell me the tax consequences of selling?
It can show the realised gain or loss a sale would crystallise, the holding period, and the cost basis used. It does not calculate tax owed, apply your jurisdiction's rules, or advise on timing. Those require a qualified tax professional.
Example output on the Demo portfolio: selling the full Apple position would realise $24,079.45 against a $10,156.50 basis, held since the recorded purchase date. What that means for tax depends entirely on your circumstances.
Source: Demo portfolio › Common
How do I account for holdings in a tax-advantaged account?
Snowball Analytics supports multiple accounts under one portfolio, so holdings can be grouped by account and analysed separately or together. Ask can restrict any question to one account.
This matters most for income questions: a withholding-free account and a taxable one produce different net yields on the same holding, and blending them into one average obscures both.
Source: Method
What fees have I paid in total?
Transaction fees recorded with your trades are summed and shown against the capital deployed, so the drag is visible as a percentage rather than a list of small charges.
Fee visibility depends on what your broker export includes; where fees are present in the import they are attributed to the relevant holding and reflected in cost basis.
Source: Method
Does Ask handle multiple currencies in one portfolio?
Yes. Holdings keep their native currency, you choose a reporting currency, and every aggregate, whether value, income or return, is shown in that currency.
the Snowball Analytics public portfolios show the range: the Demo portfolio reports in USD with EUR exposure, while Utbyttereisen reports entirely in NOK at a total value of NOK 7,826,261.06 with NOK 548,166.76 of annual income.
Source: Public portfolios
Why does my portfolio value differ from my broker's?
The usual causes are measurable and Ask will list them: pricing timestamp, whether accrued dividends are included, the currency each holding is valued in, pending trades, and cash not yet synced. Each is checked against your data rather than guessed at.
The Demo portfolio's $190,003.31 includes $19,485.09 of cash across two currencies. A broker view that excludes cash, or prices at a different close, will not match, and the difference is reconcilable line by line.
Source: Demo portfolio › Common
How Ask works: data, brokers, privacy & limits
How the data gets in, what the answer is computed from, what stays private, and what the free plan covers.
Covers searches for connect portfolio to ChatGPT, portfolio MCP server, is it safe to give AI my portfolio
Can ChatGPT or Claude see my portfolio?
Not by default. A general chatbot has no access to your holdings, no prices and no transaction history, so anything it says about “your” portfolio is inferred from what you pasted. Ask works from your synced holdings instead.
The practical difference: a pasted list supports commentary, while connected data supports arithmetic: cost basis, realised versus unrealised return, forward income by month, and look-through fund exposure all require the full transaction history.
Source: Method
Is it safe to paste my holdings into a chatbot?
Pasting a holdings list puts your positions into a general-purpose service you do not control, and the answer you get back is still ungrounded, because it has no prices, no dates and no cost basis. Ask reads your data under read-only access instead.
Access is read-only. What is sent is anonymized, and Snowball Analytics does not use it to train models; in Claude, Cursor or another app, that depends on the app's own settings. No investment recommendations are produced.
Source: Snowball Analytics MCP
How does Ask avoid inventing numbers?
Every figure in an answer is computed from your stored holdings and transactions rather than generated by a language model. The model chooses which calculation the question calls for and explains the result; it does not produce the arithmetic itself.
This is the difference that matters in practice: a model asked for a portfolio's yield will produce a plausible number, while a computed answer produces the number your holdings actually support: 2.1% on the Demo portfolio, from $3,587.93 of forward income on $190,003.31.
Source: Demo portfolio › Dividends
How do I get my portfolio into Snowball Analytics?
Two routes. Automatic sync connects a supported broker and keeps holdings, transactions and cash current. Import accepts a broker statement or spreadsheet for accounts without a connection, and both can coexist in one portfolio.
Snowball Analytics supports 1,000+ brokers and 70+ exchanges, so most portfolios sync rather than import. Once connected, the context Ask works from stays current without a separate routine.
Source: Snowball Analytics
How many questions can I ask?
Ask is available to everyone on the web and in the mobile app, on every plan, with usage limits that depend on the plan. Registration comes with a 14-day free trial that includes paid features, and no credit card is required.
Ask inside Snowball Analytics and the MCP connection are two ways to reach the same tools. MCP, which connects your portfolio to Claude, Cursor and other AI apps, is part of the Expert plan.
Source: Snowball Analytics plans
Can I connect my portfolio to Claude, Cursor or other AI apps?
Yes, through Snowball Analytics MCP. You generate a key on the MCP tab of your profile and paste it, with the server address shown there, into Claude, Cursor or another app that supports MCP. It is read-only, it is part of the Expert plan, and regenerating or deleting the key stops access immediately.
Fourteen tools are available across MCP and the in-app Ask feature, covering holdings and metrics, income and activity, and company fundamentals and goals.
Source: Snowball Analytics MCP · How to connect
What data can Ask actually see?
Holdings and weights, transaction history, cash balances, dividends received and forecast, portfolio metrics, target allocations and goals, plus market data for the securities you hold. It cannot see anything you have not connected or entered.
That boundary is why some questions return a request for input rather than an answer: expenses, tax residence and risk tolerance are not part of your portfolio data, so Ask asks rather than assumes.
Source: Snowball Analytics MCP
Does Ask give investment advice?
No. Ask describes and calculates: what you hold, what it has done, what the arithmetic implies under assumptions you can see. It does not recommend securities, tell you what to buy or sell, or assess whether anything suits your circumstances.
This is a deliberate design boundary rather than a limitation of the model. Where a question calls for a personal recommendation, the answer returns the relevant measurements and the assumptions behind them, and leaves the decision where it belongs.
Source: Snowball Analytics
What language can I ask questions in?
Ask answers in the language you write in. English, Spanish, Portuguese, German, Dutch, Norwegian, Czech, Lithuanian and Arabic all work, and the underlying calculation is identical whichever language you use: only the wording of the explanation changes.
Numbers, dates and currency formatting follow your portfolio's reporting settings rather than the language of the question, so a figure you read in Spanish matches the figure on your dashboard exactly.
Source: Method
Can I ask follow-up questions?
Yes, and a portfolio review is normally a chain of questions rather than one. Follow-ups inherit the context of the previous answer, so “and what about from August?” or “now assume 50% reinvestment” works without restating the portfolio or repeating the assumption.
That is what makes a short fragment usable. A three-word follow-up only resolves because the previous answer and your holdings are both still in context, which is the part a fresh chat window cannot reproduce.
Source: Method
In the app, or from Claude, Cursor and other AI apps
Ask lives inside Snowball Analytics on every plan. If you would rather work where you already chat, Snowball Analytics MCP connects your portfolio to Claude, Cursor and other apps that support MCP, as read‑only tools. MCP is part of the Expert plan.
Ask, inside Snowball Analytics
Nothing to install. Your portfolio is already there and charts render alongside the answer. Ask works on the web and in the mobile app, on every plan, with usage limits that depend on the plan.




Snowball Analytics MCP for Claude, Cursor and other AI apps
Fourteen read‑only tools covering holdings and metrics, income and activity, fundamentals and goals. Generate a key on the MCP tab of your profile, paste it into the app once, and regenerate or delete it whenever you like. Snowball Analytics does not train models on the data and does not provide investment recommendations.
Start free, and keep the tracker either way
Portfolio tracking, dividend history and the public community are available without paying. Ask is included on every plan, and how much you can ask depends on the plan.
On the web and in the mobile app, with usage limits that depend on the plan.
Registration comes with a 14‑day free trial that includes paid features. No credit card required.
Connect your portfolio to Claude, Cursor and other apps that support MCP, as read‑only tools.
Ask sits on top of the whole Snowball Analytics ecosystem
Every answer draws on the same data these tools display, so what you read in a chart and what you hear in an answer always agree.
Stop asking AI about a hypothetical portfolio
Connect a broker, then ask the same questions you just read, answered against your holdings instead of someone else’s. 14‑day free trial, no credit card.
Start for free, no card required